|
|
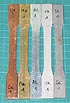
In the application center of our company
tensile tests were carried out to determine characteristic values at metal
specimens. The table below shows the measured values. The different diagrams
are shown at the detail page.
Description of the Tensile Test
| Material |
Scanner |
Values |
| |
|
Youngs
Modulus
[MPa] |
Rp0,2
[N/mm^2] |
Rm
[N/mm^2] |
Ag
[%] |
A
[%] |
µ
|
ReL
[N/mm^2] |
ReH
[N/mm^2] |
Details |
| Aluminium |
K-50 |
62.600 |
187 |
218 |
8,51 |
17,2 |
0,31 |
|
|
 |
 |
| Steel |
K-50 |
193.000 |
238 |
314 |
24,4 |
44,7 |
0,37 |
238 |
281 |
 |
 |
| Stainless Steel |
K-50 |
192.000 |
316 |
723 |
61,3 |
77,3 |
0,23 |
|
|
 |
 |
| Copper |
K-50 |
117.000 |
331 |
336 |
0,573 |
11,6 |
0,40 |
|
|
 |
 |
| Brass |
K-50 |
93.400 |
375 |
472 |
12,4 |
18,3 |
0,44 |
|
|
 |
 |
|