The 3D-Strain-Time-Diagram shows Lueders bands in the strain range up to 5 %.
|
Stress-Strain-Diagram with Characteristic Values 
The 3D-Strain-Time-Diagram shows Lueders bands in the strain range up to 5 %. 
The Lateral Strain-Longitudinal Strain-Diagram shows a uniformly shaped curve. The bent area around 2 - 5 % longitudinal strain is caused by the differend measuring ranges for the Lueders bands. 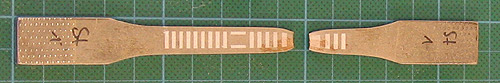
Specimen after Tensile Test Description of an other Strain Measurement at a Steel Specimen. |