Strain Measurement at Aluminium
|
Locally Resolved StrainA laser extensometer type W-80 was used to measure strain at an aluminum sample. The specimen was equipped with 18 markers. Throughout the experiment, time, force and strain were recorded. The data evaluation software automatically calculates the stress from the force and the initial cross section. Stress Strain Diagram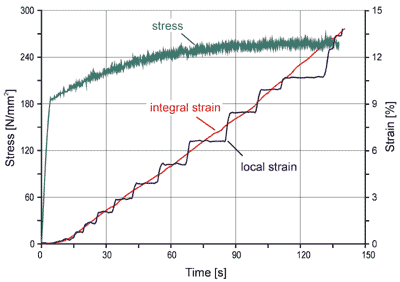
The figure on
the right hand side shows a stress strain diagram, and two strain time
diagrams. The noise in the stress signal represents actual variation in the
load of the specimen. Distribution of Strain Over The Sample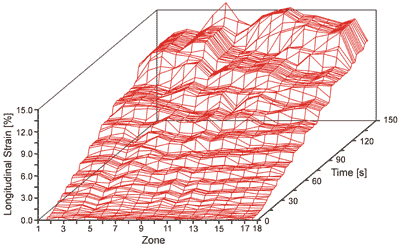
The next figure depicts the distribution of strain along the specimen over time. Data points connected by the lines 'in parallel' to the zone axis are recorded at the same time. The specimen has an inhomogeneous deformation behaviour. For instance at the end of the experiment, the zones with the larger marker numbers (17-18) reached a certain strain level, while the zones with lower marker numbers (16-17, 15-16, ...) come to this strain level later in time. The strain 'starts' at the right hand side and grows to the left hand side. |